The Visual Statistical Calculator is derived from the original Statistical Calculator.
In this new version, the Statistical Calculator is presented in a visual programming environment where the user is able to
visualize the sequence of steps as a flowchart, which facilitates retention of knowledge. Each operation consists on the selection
of a function from the modules available in the right pane and the drag to the desktop program. Besides the traditional
functions of the Statistical Calculator, the new visual system has extra features such as choice of language and other options
to save and retrieve the workspace.
The Visual Statistical Calculator has three modules:
- Statistical Quality Control Module
- Descriptive Statistics Module
- Probability Module
>>
Click here to download the Visual Statistical Calculator <<
(Examples of data files:
Data1,
Data2,
Data3)
Examples of the Visual Statistical Calculator in use can be seen in the imagems below.
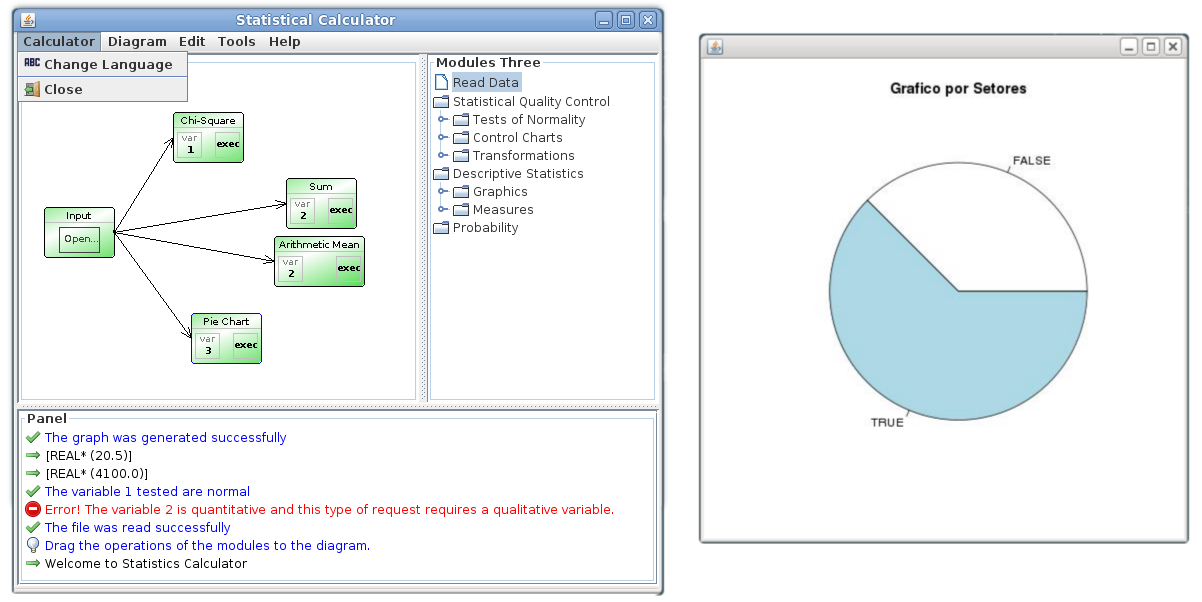
Figure 1: Example of the Statistical Quality Control and Descriptive Statistical Modules from the Visual Statistical Calculator.
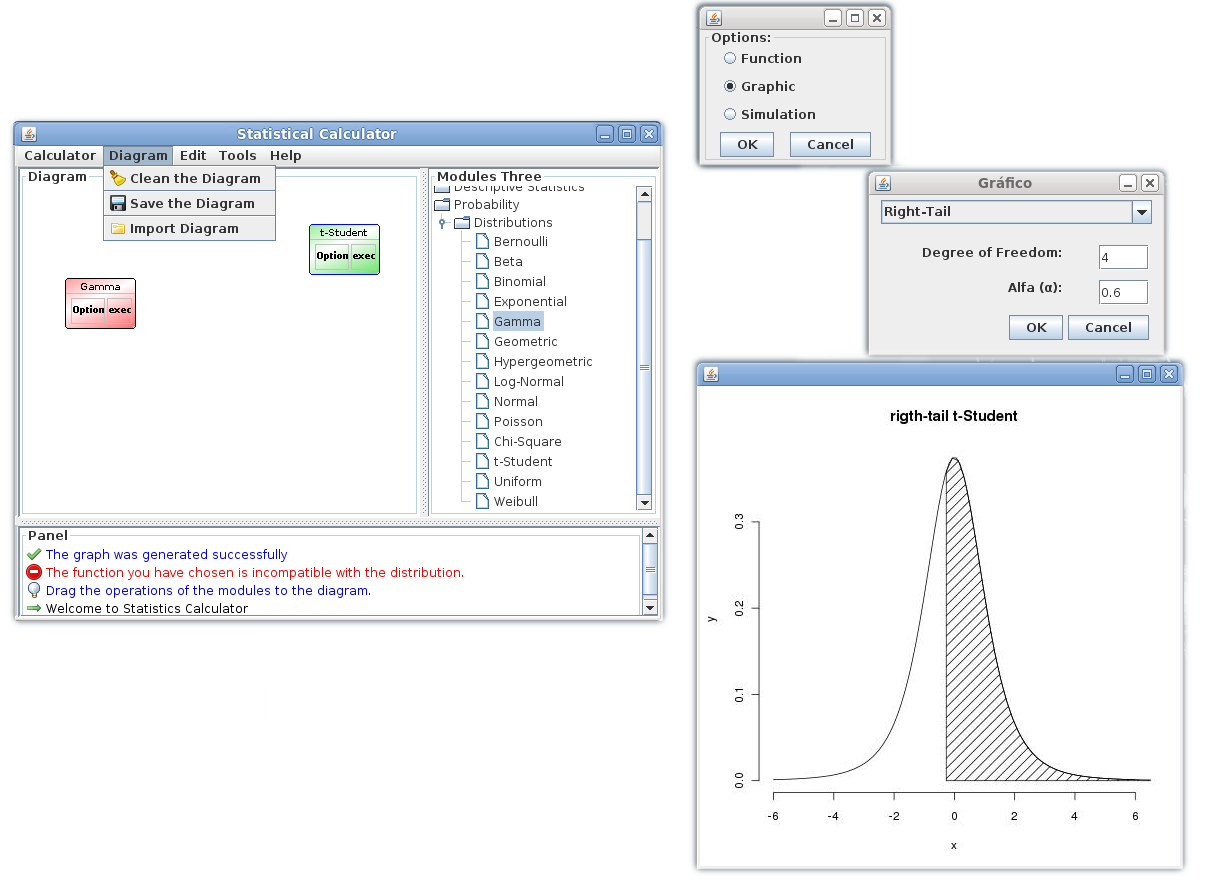
Figure 2: Example of the Probability Module from the Visual Statistical Calculator.
Team
- Elaine Anita de Melo Gomes Soares
- Gedvan Pereira Dias
- Herbet Ferreira Rodrigues
- Liliane dos Santos Machado
- Renata Grigório Silva Gomes
- Ronei Marcos de Moraes
 Return