The present project intends to solve the problems related to modeling and decision-making on the occurrence of COVID-19 (Sars-CoV-2), offering a possibility of guidance for preventive public health policies.
Therefore, we intend to investigate and make available methodologies based on official data and with high accuracy which allow to model and provide decision support for health managers on this public health problem.
It is intended to publish partial results in a website providing to population and managers daily updates on this condition to increase epidemiological surveillance actions in order to combat COVID-19.
Access:
COVID-19 in Brazil
COVID-19 in Paraiba state
COVID-19 in Brazil up to November 28, 2021*
*Includes only data confirmed by the official platform of Brazilian Ministry of Health and from
Brazilian Council of Health Secretaries (CONASS).
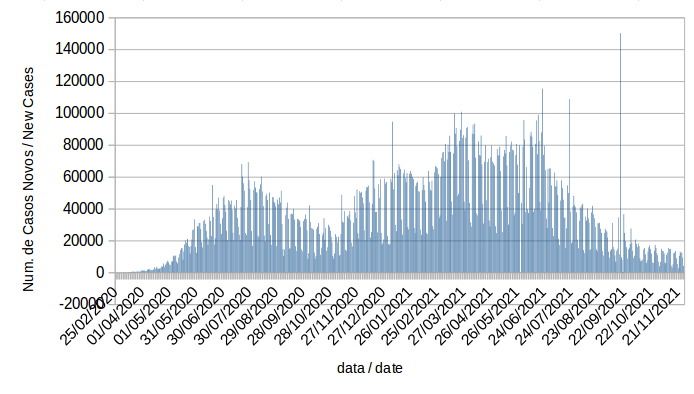
Number of new cases in Brazil at present day▲
Graphic of new cases registered in Brazil (by day) ▲
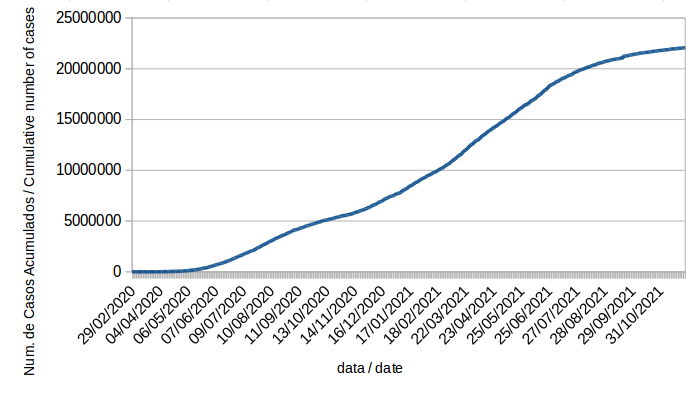
Cumulative number of cases in Brazil ▲
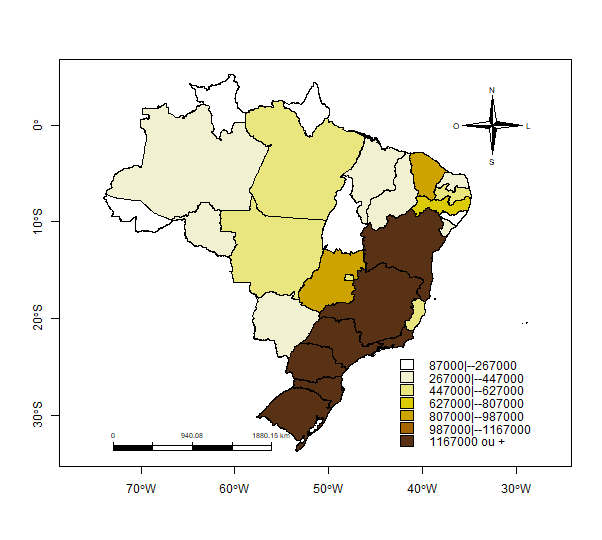
Graphic of cumulative number of cases in Brazil ▲
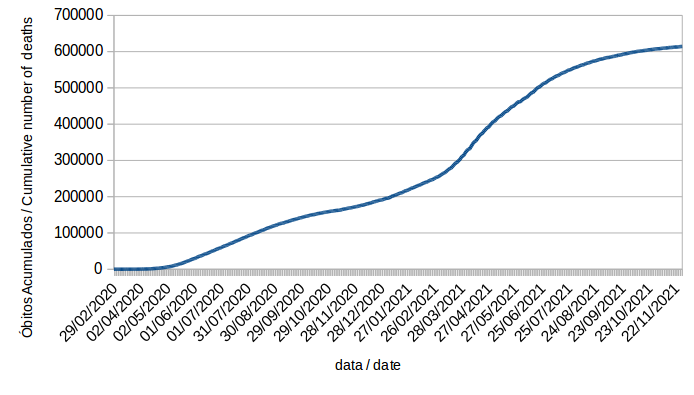
Cumulative number of deaths in Brazil ▲
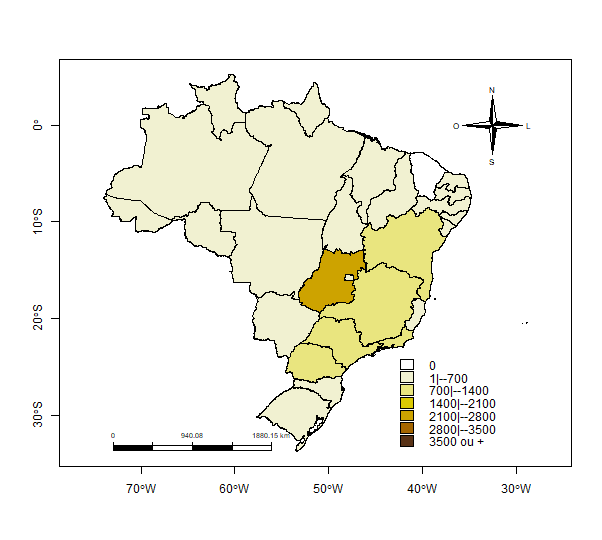
Spatial Incidences Ratio of cumulative number of cases in Brazil ▲
The Spatial Incidences Ratio (
SIR) presents the two incidences in a phenomenon occurrence, i.e., the local incidence with respect to incidence from all geographical region of interest. The first one presents the ratio between the number of cases computed in a subarea (in this case each state of Brazil) with respect to the population at risk in that same subarea. The second one presents the ratio between the total number of cases computed in all geographical region (in this case is the Brazil country), with respect to the total population at risk in that.
Formally, the SIR is given by the equation:
where: a geographical region of interest is composed by n subareas denoted by , which are the Brazilian states. The variable V is the number of cases registered in each one of those subareas and the variable X is the population at risk in each one of those subareas.
The interpretation of SIR is simple and allows
a direct comparison among the subareas . The table below shows its interpretation.
| | |
There is no cases registered in that subarea |
| |
The SIR in that subarea is less than the half of geographical region incidence |
| | |
The SIR in that subarea is greater or equal than the half and less than one times the geographical region incidence |
| | |
The SIR in that subarea is greater or equal than one times the geographical region incidence, but does not exceed it by more than 50% |
| | |
The SIR in that subarea is greater or equal than one and half times the geographical region incidence, but does not exceed it by more than two times. |
| | |
The SIR in that subarea is greater or equal than two times the geographical region incidence |
For more technical details about
SIR and its applications to Spatial Epidemiology, please click on:
Lima et. al. (2019a) (in Portuguese) and/or
Lima et. al. (2019b) (in English).
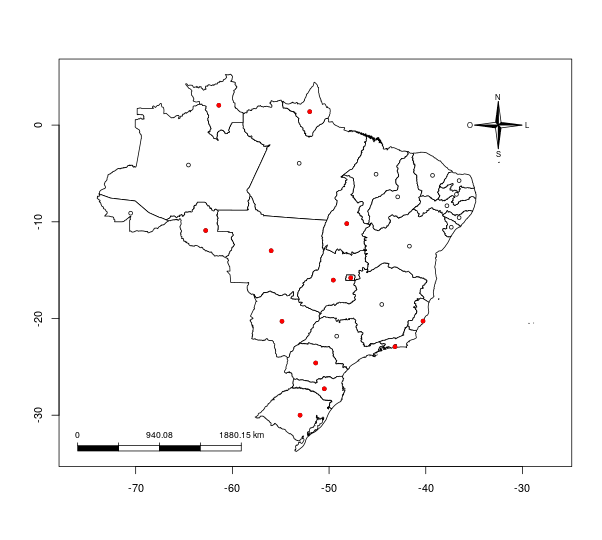
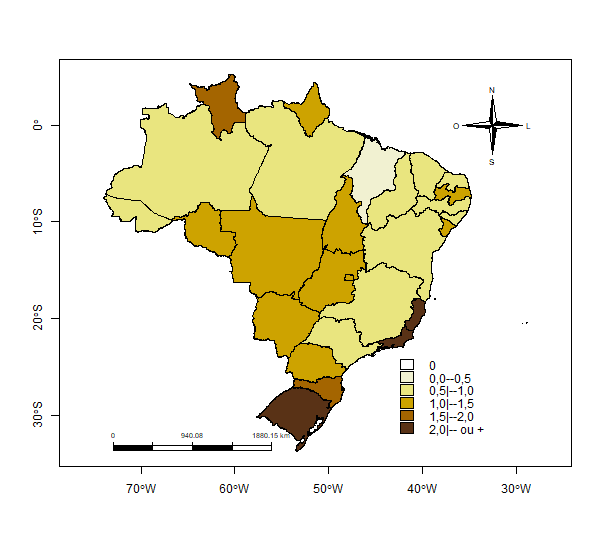
Spatial Analisys of cumulative cases registered in Brazil* ▲
*statistically significant values
The map of spatial analysis presents the centroids of states with different and significative values, from the statistical point of view, that compose spatial clusters. It means that neighboor states or single states with high values and with statistical significance compose a spatial cluster on the map. The methodology used was Spatial Scan Statistic. More technical details can be found at
Lima et al. (2019b).
The map highlights in red the significant states.
A large spatial cluster is composed by the states of
Rio Grande do Sul, Santa Catarina, Paraná,
Mato Grosso do Sul,
Mato Grosso, Rondônia,
Goiás,
and Tocantins
and Distrito Federal (Brazilian Federal District).
A second spatial cluster is composed by the states of
Espírito Santo e Rio de Janeiro in South-East of Brazil.
The states of
Amapá,
and Roraima,
are single spatial clusters.
COVID-19 in Paraíba state up to November 28, 2021*
*Includes only data confirmed by the official platform of Brazilian Ministry of Health, from
Brazilian Council of Health Secretaries (CONASS)
and from Paraíba State Secretary of Health.
Number of new cases in Paraíba State at present day ▲
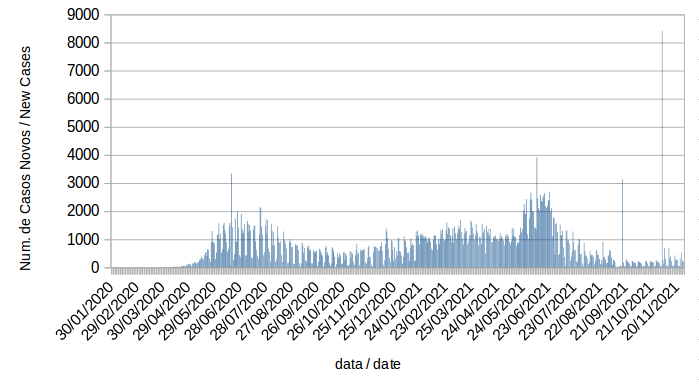
Graphic of new cases registered in Paraíba (by day)▲
Cumulative number of cases in Paraíba State▲
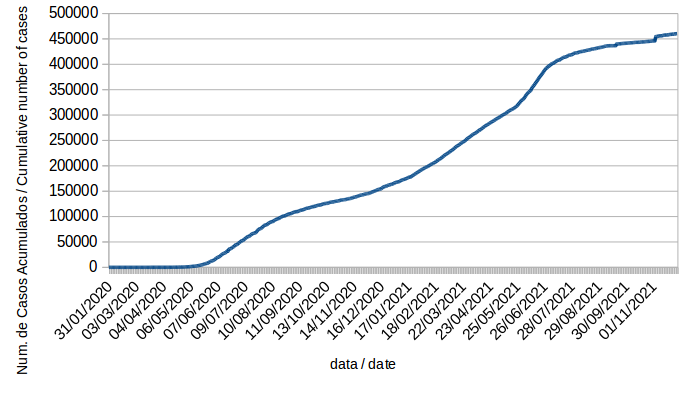
Graphic of cumulative number of cases in Paraíba State▲
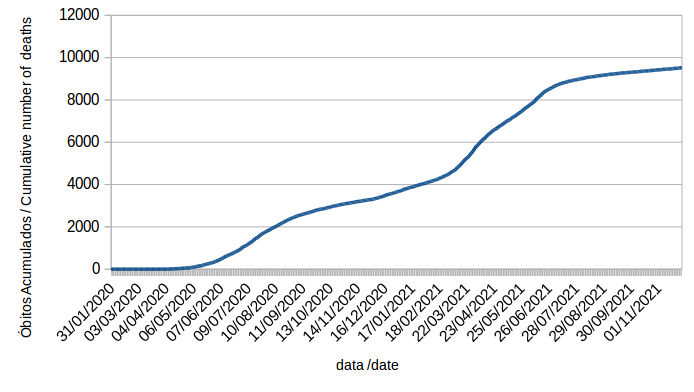
Cumulative number of deaths in Paraíba State▲
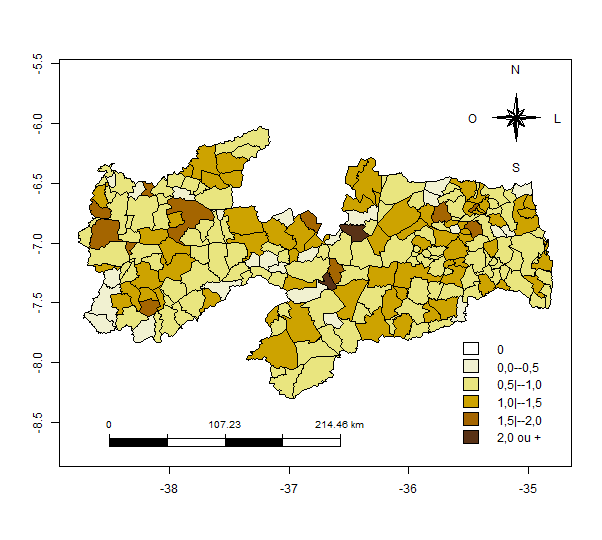
Spatial Incidences Ratio of cumulative number of cases in Paraíba State▲
(The Spatial Incidences Ratio or SIR is explained above. Click here in order to see the concept.)
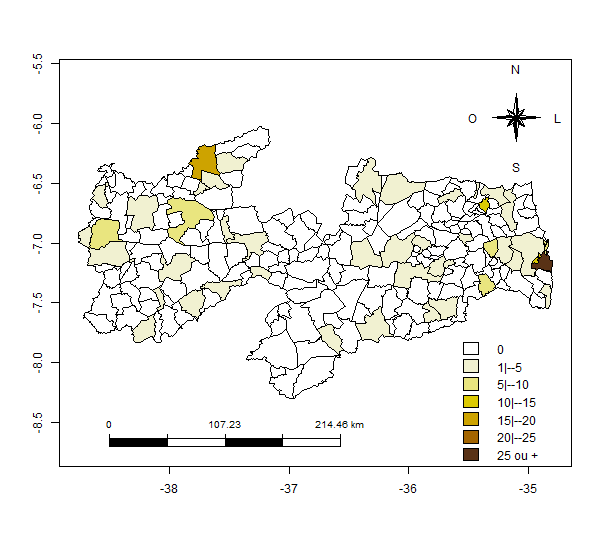
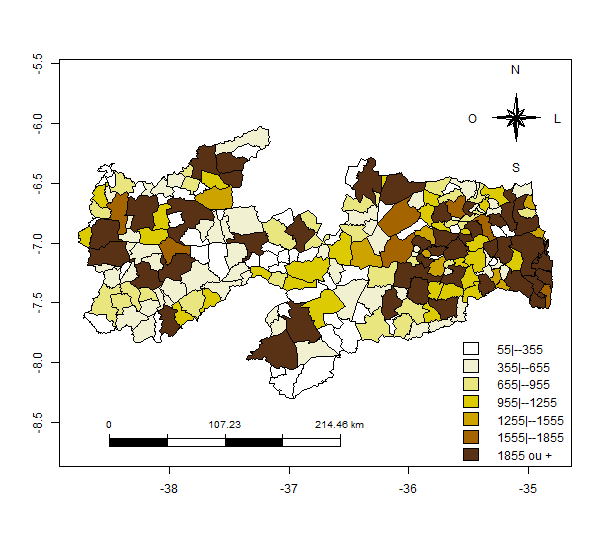
Spatial Analysis of Cumulative number of cases in Paraíba State* ▲
*statistically significant values
The map of spatial analysis shows the centroids of municipalities from Paraí State with different and significative values, from the statistics point of view, that compose spatial clusters. It means that neighboor municipalities or single municipalities with high values and with statistical significance compose a spatial cluster of the map. The methodology used was Spatial Scan Statistic. More technical details can be seen at
Lima et al. (2019b).
The map highlights in red the municipalities of
Itabaiana,
and Juripiranga,
which compose a spatial cluster at South-East of the State of Paraíba.
The municipalities of
Solânea, Casserengue,
and Algodão de Jandaíra
compose a spatial cluster at East of the map. In the same region, the municipalities of
Pilõezinhos, Guarabira, Alagoinha, Cuitegi, Alagoa Grande,
Campina Grande,
Barra de São Miguel, Boqueirão, Caturité,
Riacho de Santo Antônio, Alcantil,
Serra Redonda,
Juarez Távora and Ingá compose
other one.
The municipalities of
Rio Tinto, Marcação, Baía da Traição,
compose a spatial cluster at North-East of the State.
At north-Northeast, the municipalities of
Caiçara,
Tacima,
Belém,
Serra da Raíz, Sertãozinho,
Lagoa de Dentro
and Duas Estradas
compose a spatial cluster.
The municipalities of
João Pessoa and Cabedelo compose a spatial cluster at East.
At center-West, the municipalities of
Catolé do Rocha,
São Bento,
and Brejo do Cruz
compose a spatial cluster. At West, the municipalities of
Piancó, Ibiara, Diamante,
Itaporanga, Boa Ventura, Curral Velho,
São José da Lagoa Tapada, Coremas, Pombal and São Domingos,
compose a spatial cluster.
At West, the municipalities of
Triunfo, Santa Helena,
Bom Jesus
and Cajazeiras, compose a spatial cluster.
At center-South, a spatial cluster is composed by the municipalities of Sumé and Monteiro.
At the center-North of the State, São José do Sabugi,
Areia de Baraúnas,
São Mamede,
Santa Luzia,
and Patos
compose a spatial cluster.
Near them the municipalities of Frei Martinho, Picuí
Nova Palmeira
and Baraúna compose other spatial cluster.
The municipalities of
Parari and Santo André compose a spatial cluster at the central zone of the State.
The municipalities of Aroeiras and Gado Bravo at center-South compose another spatial cluster.
The municipalities of
Carrapateira
and Lastro
(West),
Seridó
(at center-North),
Livramento at Center of the State,
Itapororoca and
Esperança (at north-Northeast)
and
Mari
(East)
and Alhandra (South-East)
are single spatial clusters.

Team
- Ronei Marcos de Moraes (Coordinator - Departament of Statistics - UFPB)
- Liliane dos Santos Machado (Departament of Informatics - UFPB)
- Ana Cláudia Oliveira de Melo (Departament of Statistics - UFPB and PhD candidate in Decision and Health Models - UFPB)
- Claryce Rebeca de Souza Feitosa (scholarship PIBIC/CNPq/UFPB - Geoscience undergraduation student - UFPB)
- Luciana Moura Mendes de Lima (CAPES scholarship for PhD in Decision and Health Models - UFPB)
- Luiz Henrique da Silva (CNPq scholarship for Master in Decision and Health Models - UFPB)
 Return